MATASII 10Y UST – TNX CALL – CHART UPDATE
MATASII 10Y UST – TNX CALL – CHART UPDATE

![]() Gordon Long
TNX, TRIGGER$ March 2018
Gordon Long
TNX, TRIGGER$ March 2018
MATASII 10Y UST – TNX CALL – CHART UPDATE

![]() Gordon Long
TNX, TRIGGER$ March 2018
Gordon Long
TNX, TRIGGER$ March 2018
MATASII 10Y UST – TNX CALL – CHART UPDATE

INDEXES/ Technical Analysis/ USD
![]() goldenphi
Market Road Maps, USD Road Map
goldenphi
Market Road Maps, USD Road Map
USD Weekly: we have been watching for a touch of the large blue ellipse since the lift in 2015- this has now occurred. Please review previous updates for its significance. It is possible that the drop starting in 2017 is now over, or very near to it. There is also the bottom support of the […]

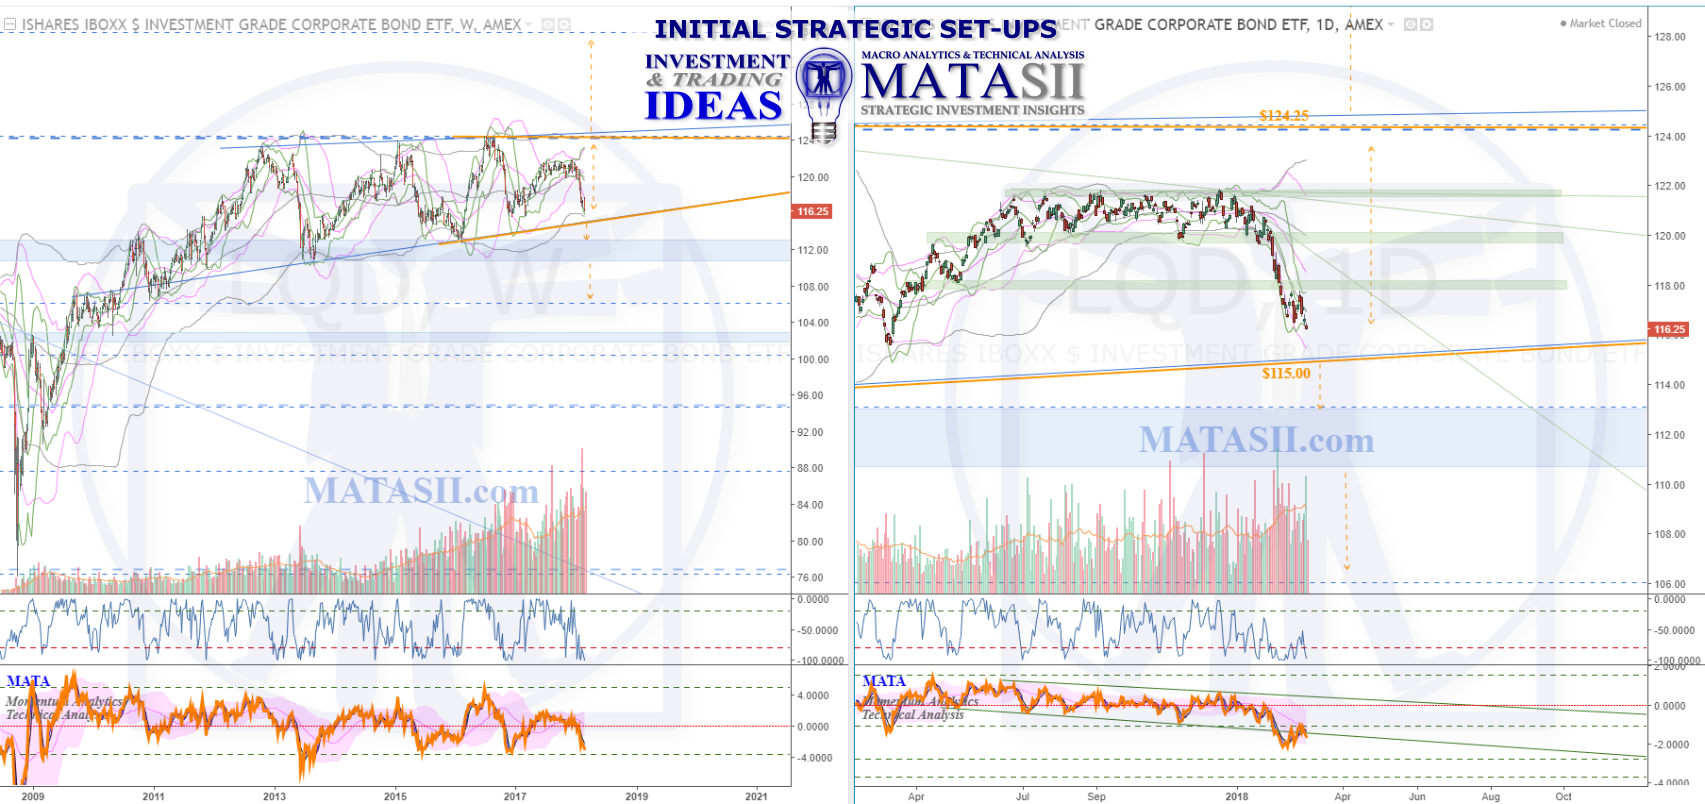
The weekly (left) chart for LQD shows a significant lift from $78.00 in 2009; topping around $124.00 in 2012; and moving sideways in a slightly contracting wedge since. The boundaries of the wedge pattern offer technical trigger considerations when reached (highlighted with solid orange). The market is currently on its way to the lower support […]