FACEBOOK: 183.50 SHORT TRIGGER DELIVERED 21% MATASII GAINS
FACEBOOK: 183.50 SHORT TRIGGER DELIVERED 21% MATASII GAINS
FB CHART AS OF CLOSE 12-12-18
Business Summary (yahoo Finance)

Facebook, Inc. operates as a social networking company worldwide. It provides a set of development tools and application programming interfaces that enable developers to integrate with Facebook to create mobile and Web applications. The companys products include Facebook mobile app and Website that enable people to connect, share, discover, and communicate with each other on mobile devices and personal computers; Messenger, a mobile-to-mobile messaging application available on Android, iOS, and Windows phone devices; Instagram, a mobile application that enable people to take photos or videos, customize them with filter effects, and share them with friends and followers in a photo feed or send them directly to friends; and WhatsApp Messenger, a cross-platform mobile messaging application that allows people to exchange messages on iOS, Android, BlackBerry, Windows phone, and Nokia devices. As of December 31, 2014, it had 1.19 billion monthly active users and 890 million daily active users. Facebook, Inc. was founded in 2004 and is headquartered in Menlo Park, California.
MATASII WATCH LIST TRIGGERS / GAINS: 20.89%
INITIAL FB Facebook IDEA: July 10th, 2018
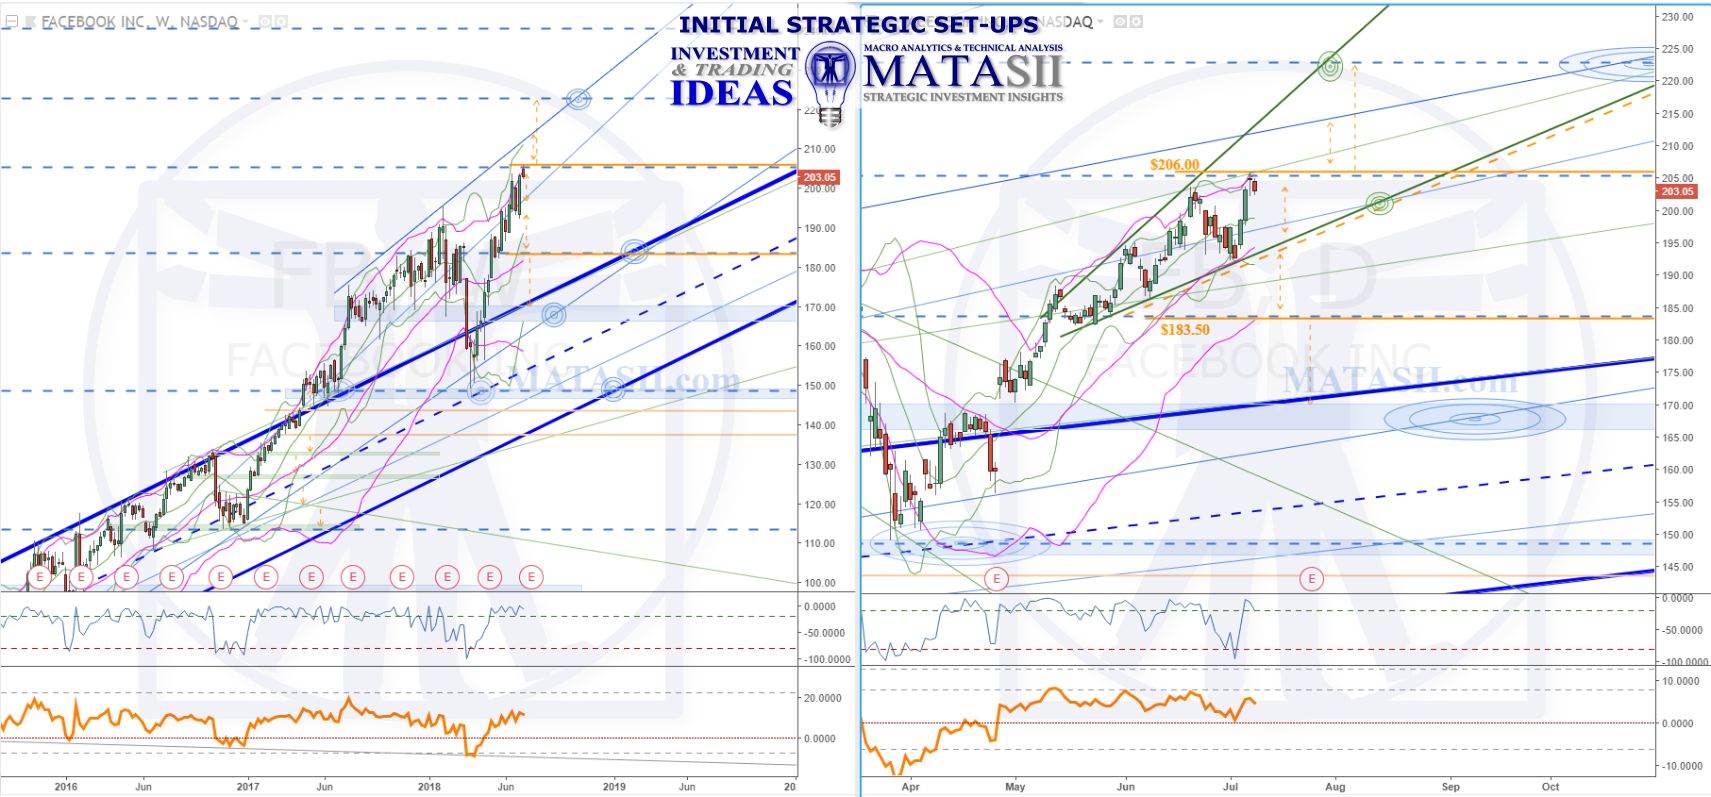
The large blue channel that can be seen on the weekly chart (left) goes back to 2013; FB breaks out of it for the 1st time in April 2017. Note the lift and break from the channel moves sideways in to a weekly (blue) HPTZ before testing the channel and lifting to the next Fibonacci level. It then falls from highs at the end of Jan 2018, dropping back in to the blue channel and finds support at the channels mid-point, the previous Fibonacci level and another HPTZ. Since the end of March 2018 FB has had a steady lift, reaching new highs, and currently sits at the next Fibonacci level. Some resistance can be seen and we are watching to see what kind of market reaction we are going to get.
The daily chart (right) offers a closer look at recent market action: we can see a green expanding wedge structure for the last lifts since about May of this year. The lower support of the wedge is marked with a dashed orange highlight, indicating potential opportunity with greater risk. While a break of the green wedge could indicate a down move, the Fib level below the market has previously offered significant support/resistance. A solid orange highlights this trigger consideration where we could then be looking back to the blue channel s/r's, a blue s/r zone and previous Fibonacci levels for the next drop.
Another solid orange line highlights the last highs and current Fibonacci level. Lifting up through this could mean a continuation of the positive trend and would have us looking to the next Fib level for a target consideration. NOTE however the green daily expanding wedge structure's resistance, as well as another blue weekly s/r on the way up: these could offer resistance to continue their structures / patterns.
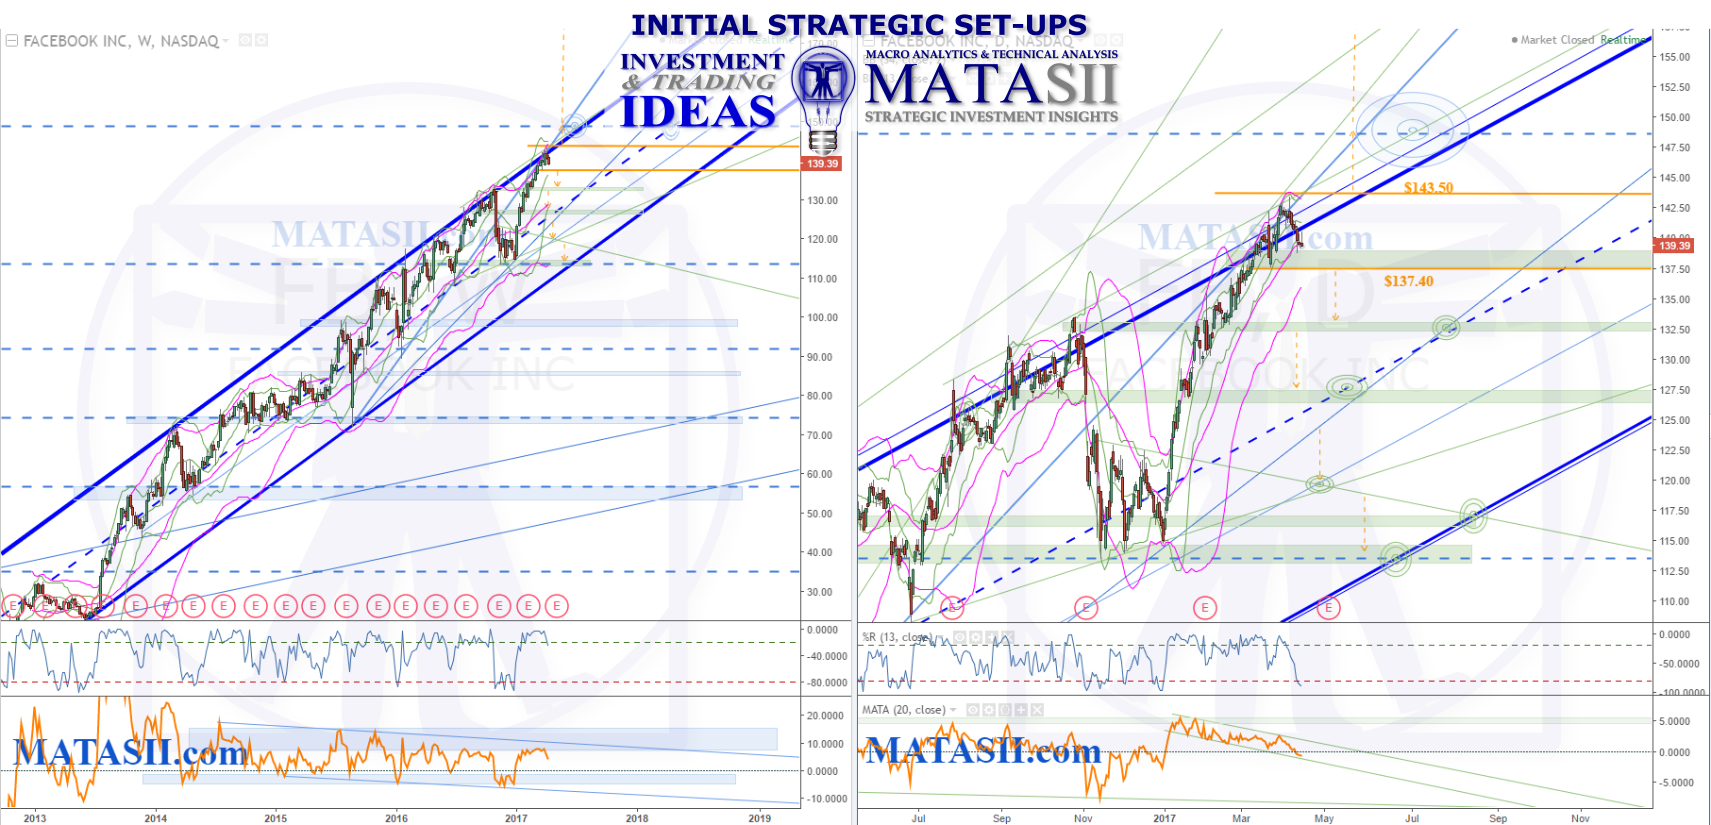
Note that FB has had some extreme and volatile movements since the lows seen in 2017 and although it may seems like a "wild ride", it has behaved technically perfect, including hitting HPTZ targets given months or a year earlier.


